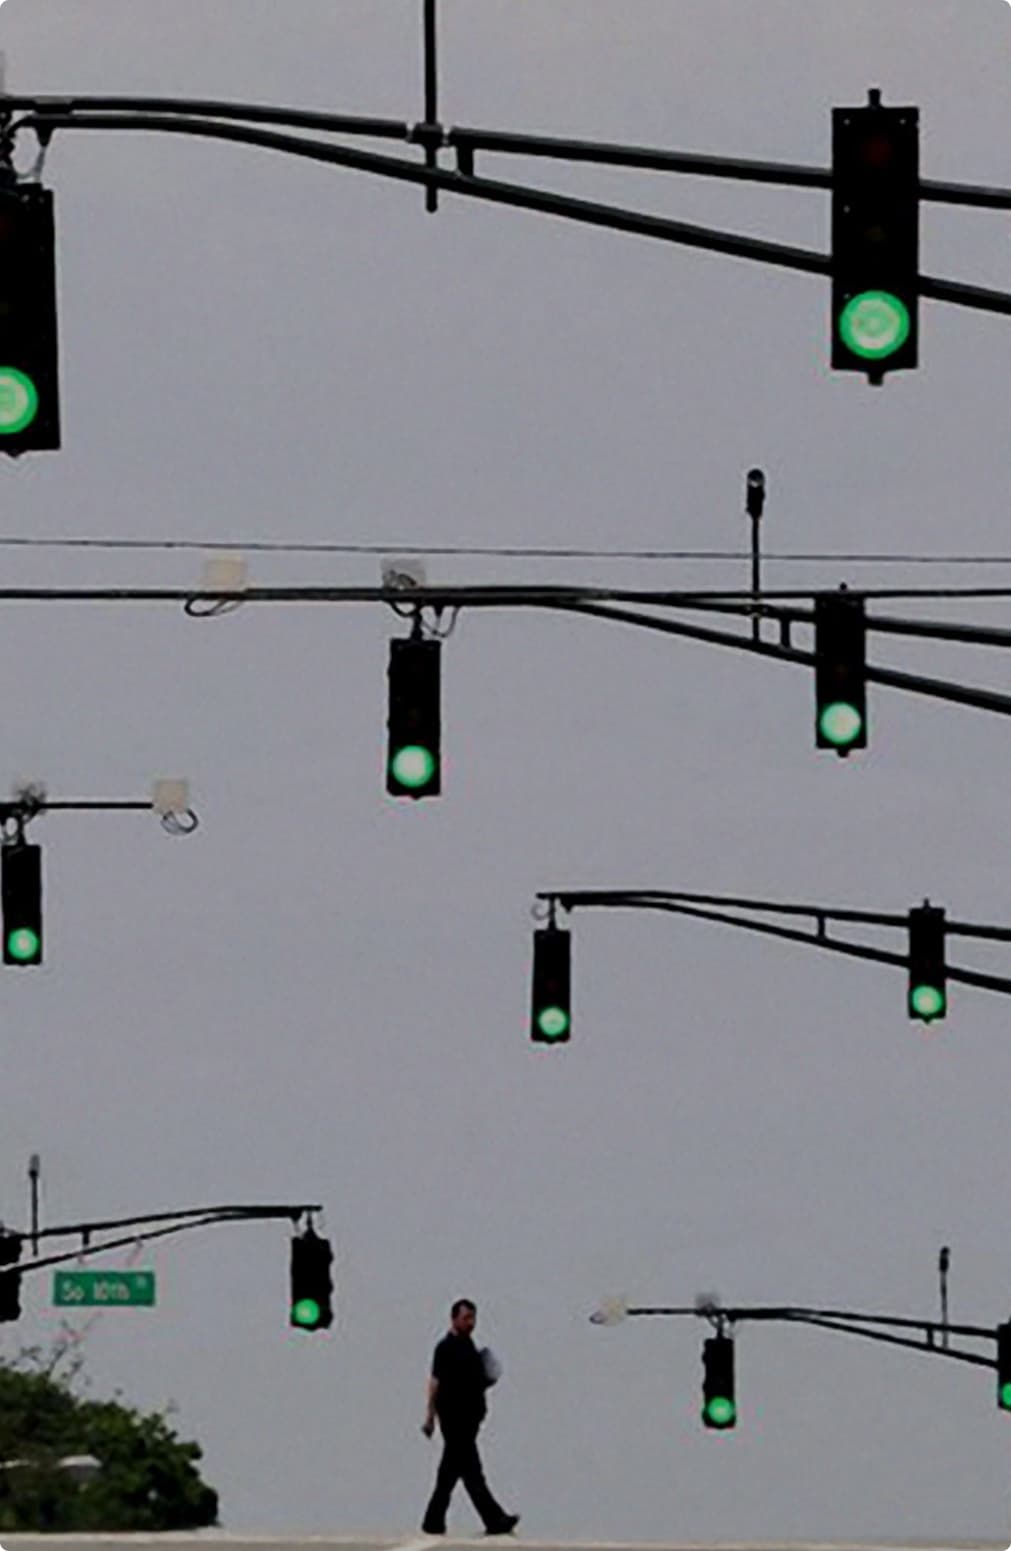
Which data points give creatives real direction?

Data is everywhere. Campaigns produce dashboards full of numbers: CPM, CPC, CTR, viewtime, ROAS, bounce rate, scroll depth… The list seems endless. But if you make creatives, you only want to know one thing: which data helps me make better visuals and copy?
The problem: most data gives insight into media or targeting, but tells you nothing about the creative choices themselves. In this blog we explain which 4 data points do give you direction, and why you can often ignore the rest.
“Data is everywhere, but only the right numbers point the way to better creative.”

1. Click-Through Rate (CTR): the basics
CTR remains the most important gauge of your creative’s power. It tells you whether the combination of image and copy was relevant enough to make someone click.
A higher CTR means your creative triggers curiosity or need. A low CTR means your message falls flat or doesn’t resonate.
A high CTR = your creative triggers curiosity or need. A low CTR = your message falls flat or doesn’t resonate.
For designers and copywriters this means: the hook needs to be stronger. Think a clearer headline, more powerful contrast or a more distinct CTA. CTR is the direct mirror of how well your creative turns attention into action.
2. Viewability and watch time: is your message really being seen?
An ad that has technically been ‘served’ hasn’t necessarily been seen. That is why viewability and watch time are crucial.
Viewability tells you what percentage of your ad was actually on screen.
Watch time shows how long someone stuck around.
This is pure gold for video and motion ads in particular. Turns out many people drop off before your message or logo appears? Then you know your core comes too late. That insight translates directly into design decisions: get to the point faster, visual hook in the first seconds.
3. Engagement & scroll-stops: does your creative grab attention?
Engagement goes beyond clicks. On platforms like TikTok, Instagram or LinkedIn, it is often more valuable to know whether your ad makes people stop scrolling. Metrics like likes, shares or comments can provide social proof, but the most important signals are scroll-stops and skips.
Scroll-stops tell you whether your visual has enough stopping power.
Skips show whether your creative can hold attention.
For designers this is direct feedback on image choice and copy. A static visual that gets swiped past? Test a bold color, unexpected composition or moving element. A video that gets skipped en masse after 2 seconds? Then your opening needs to be stronger.
4. Creative fatigue: how fast does your ad run out of steam?
Even strong creatives wear out. Performance declines over time: the audience has seen the image too often. This is called creative fatigue.
By measuring how fast CTR or engagement declines, you know when it is time to bring in variants. This gives direction to your creative planning: don’t wait until everything collapses, but have new versions proactively ready.
That is why at Banny.io we always build scalable variants, so your creatives stay fresh without diluting your brand.
Not every metric is relevant
Many metrics are interesting, but not directly usable for creative work. Impressions, CPM or even ROAS say more about targeting, bidding or funnel than about the creative work itself. Of course you should track them for the overall campaign, but for design and copy decisions they add little.
So the art is: filter what is truly relevant for creatives and park the rest with media optimization.
How do you translate data into creative choices?Ready for real impact?
The secret is not in the data itself, but in the translation:
Low CTR? → work on your hook, headline or CTA.
Short watch time? → bring your message on screen earlier.
Few scroll-stops? → test more striking visuals or colors.
Creative fatigue? → plan variants, reuse your hook, but rotate image and copy.
Data shouldn’t be a wall of numbers, but a practical compass. It gives designers and copywriters direct guidance to make their work more effective.
Why measuring less often works better
The danger of modern advertising is that we get paralyzed by the amount of data. In the end, only a few data points truly give direction to creative: CTR, viewability/watch time, engagement and fatigue. Everything beyond that is noise or belongs to another part of the funnel.
At Banny.io we believe in that focus. That is why we link creative production directly to the metrics that matter. That way we don’t just make more output, but above all smarter output: fast, scalable and based on the right insights.
Want to know which data points give your creatives direction? Get in touch with us and let us analyze your current ads.